
RTS 27 – A Contribution to Transparency?
Among many requirements under MiFID II, RTS 27 demands from market makers, liquidity providers and Systematic Internalisers, the quarterly publication of data related to the quality of execution of the institutions concerned.
June 30th was the deadline for the publication of the nine tables with data on Q1 2018, and so it was with some interest, that last week we started visiting the websites of various investment firms looking for what they had published under RTS 27
The 11th of July 2018 | Alexander Beck Papadoulis, Senior Consultant, Asbjørn Leeth, Senior Manager & Christian Thygesen, Partner
It will come as no surprise to industry participants that the data published was heterogeneous – in every meaning of the word. No wonder, as lawmakers have not been particularly clear on key aspects of the data to be published. At a high level: Of the three kinds of institutions covered by this particular requirement, we find the liquidity providers – but what exactly is a liquidity provider? The definition seems sufficiently unclear, that the term has disappeared entirely from Danish law – but what about the rest of Europe? Systematic Internalisers are also supposed to report, but so far, you can only volunteer to become an SI, and if you do so, you register only on the asset class level. And what does that actually mean in terms of the reporting requirements of the SI?
A Couple of Examples
A couple of examples to illustrate; Do you have to report on instruments, that fall within the asset class in which you have declared yourself an SI, even if these instruments are not traded on a trading venue (i.e. instruments outside the infamous ToTV definition)? Do you have to report an instrument in which your trading activity has been minimal (trading activity sufficiently small to fall under the SI threshold at instrument level)? Whatever the legal answers may be, it is quite apparent from the data that in practice, there is no agreement in these areas.
In even more detail, lawmakers have hinted at “all inclusive” prices to be published but, refrained from providing any details on what the concept includes, which is particularly nebulous when it comes to derivatives. On a purely practical level, the absence of any guidance as to how the data should be formatted, beyond being “machine readable”, challenges anyone trying to take a serious look at comparing data between banks.
That is what we have engaged in, and in this document, we attempt to provide some first high-level insights into, what European banks have actually published under RTS 27. Before you get your hopes up, let us make it clear that the available data remains very far from providing any sort of answer into the original question, as to what banks actually provide the best execution.
SEE ALSO: The eye of the storm – A MiFID Christmas greeting
Here is what we have done:
We have gathered a sample of RTS 27 reports from five of the top 20 banks in Europe – specifically table 4, which contains price information. Although a larger sample of reports would have been desirable, the different banks have published their reports in such differing ways that data collection turned rather time-consuming, and so we chose five banks with the most easily accessible data.
The dataset amounted to no less than approximately 300,000 observations after removing missing values. An initial finding was that the dataset had a considerable amount of logical errors, thereby making a significant amount of data-cleaning necessary.
In the following figures, asset classes with less than 500 observations have been excluded.
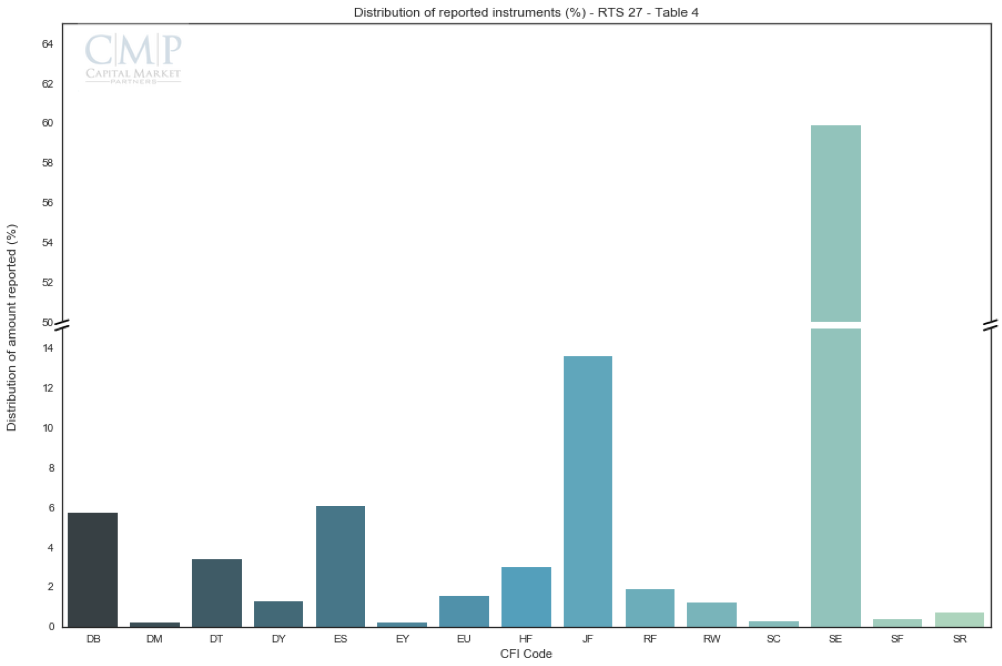 The above graph illustrates the distribution of reported instruments per asset class
Looking at the numbers above, a remarkable amount of SE (Swap Equities) are reported (60% of all observations). This is entirely driven by a single bank with almost 180,000 observations in this asset class. The 2nd most frequent observation is JF (FX Forwards) with 41,000 observations, while SF (FX Swap) scores a 3rd from the bottom position.
It is no surprise that FX Forward ranks among the highest reported, as every currency cross every day for every maturity each has a new ISIN. What is surprising however, is that the corresponding product, FX Swaps (SF), has so few instruments reported. This is probably testimony to the ongoing mess in the interpretation of a FX Swap. According to ESMA it is one instrument, and according to ANNA it consists of two FX Forwards.
The 3rd, 4th and 5th most frequent instruments are common/ordinary shares, bonds and medium-term notes with respectively 18,000, 17,000 and 10,000 observations. It seems natural stocks figure prominently, as it is the only instrument where banks have been forced to be SI since January, given the constraints of the double-volume cap mechanism limiting only the off-exchange trade of equity.
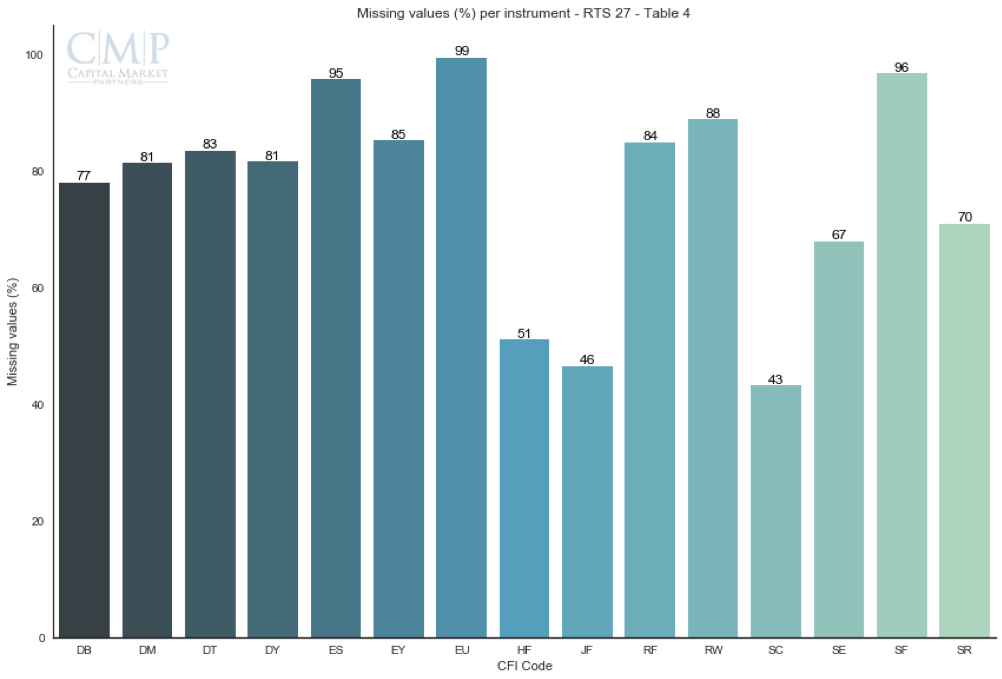 The above graph illustrates the amount of missing values (in %) per category. Missing values are instruments omitted in table 4 which means that less than one transaction a day occurred
Albeit 300,000 observations are a lot of data, in fact it is actually a dwindling amount when compared to the amount of data missing. For instance, if we take a closer look at common/ordinary shares, we experience that no less than 95% having less than two transactions on a given trade day. This adds an enormous amount of unnecessary obscuring noise that one must dig through. This begs the question: Is this really the intended transparency?
As it is probably abundantly clear, the data is very far from providing any guidance as to who actually provides best execution. What may be even more sad is that even in the future, when the dust has settled, definitions have become clearer, and coverage, homogeneity and general data quality has increased, whom will this data actually serve?
Can anyone imagine the ordinary investor sitting down going through these enormous amounts of data and getting wiser on, where to go to have your orders executed? Can you even imagine the sophisticated institutional investor (who will probably get better prices than the ones shown under RTS 27 anyway) distilling any information from this?
SEE ALSO: MiFID II Implementation
Hidden Messages and the Bigger Picture
We believe there is an interest in the messages hidden in this data, and we will keep on looking into them, and believe a lot more can be extracted than the simple, high-level headlines presented above. The interest in the news the data may reveal, comes from the banks wanting to understand the behavior of their competitors, and while we live from serving our customers, we are uneasy with the bigger picture.
The whole point of RTS 27 is well aligned with one of the key aims of MiFID: Transparency. In theory, the idea that firms trading off exchanges beyond a certain limit were supposed to publish data on how well they execute clients’ orders is great from a consumer point of view. However, the concrete effect of RTS 27 seems to be going in the opposite direction by digging the trench between the market insiders and their customers even deeper. That was hardly the intention with MiFID II in general and RTS 27 in particular?
 Alexander Beck Papadoulis, Senior Consultant
Alexander has been a part of CMP’s Investment Management team since he completed his MSc in Economics from SDU in the beginning of 2017. He has prior experience from the consultancy business from when he worked at Ramboll Management Consulting as a Junior Consultant.
Read more about Alexander and our other consultants here

